It’s been a while since our last guest post, so we’re pleased to share these insights from Quilter Cheviot Investment Management. Do let us know if you have any questions!
One of the foundational concepts of investing is that by taking risk with my money, I should receive a better return than if I choose not to take risk.
This is just logical. We would all be pretty hacked off if we went to the casino and won a bet on the roulette wheel, only for the croupier to return our original stake to us without profit. That casino would empty out pretty quick.
When the rate of return that you get for taking no risk is zero, it is easy to see why one would want to take risk to generate some (any) return. But today the risk-free rate isn’t zero, it is the highest it’s been in fifteen years.
4.5% certainly feels like a much higher hurdle rate than 0% (mainly because it is!). But it feels like a particularly large hurdle whenever those investors who wish to take very little risk have been starved of anything resembling yield for so long. It also feels like a high hurdle rate in an “uncertain world” (spoiler alert – the world is always uncertain).
If taking risk by providing capital to businesses won’t generate returns in excess of this higher cash rate, then what is the point of investing at all?
Before we all decide to pack up our bags and go home, the good news is that historically equities mostly outperform cash over sensible time frames, usually regardless of where interest rates sit.
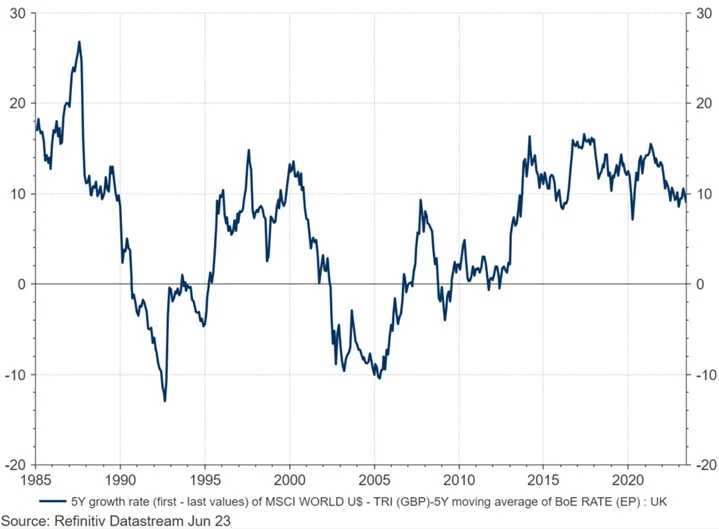
The below chart shows the excess annual return generated by the global stock market versus cash* over rolling five-year periods, beginning 1985. Put another way, when the blue line is above 0, you would have been better off in equities than cash over the five years preceding that date.
As we can see, the majority of the time equities have beaten cash over those five-year time frames, 74.2% of the time to be precise.
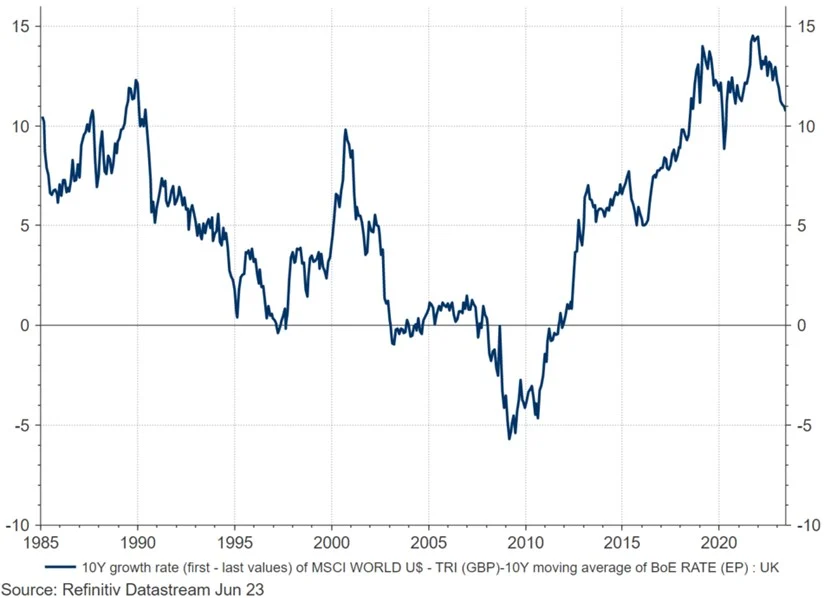
Over ten-year rolling periods, stocks outperformed cash 85.5% of the time.
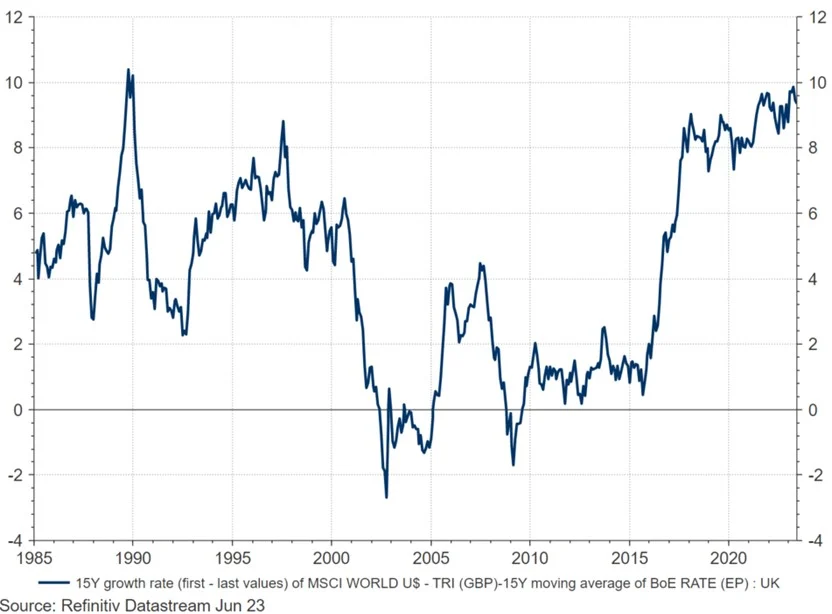
And finally for 15-year rolling periods stocks have outperformed cash 91.3% of the time (apart from a couple of relatively brief periods post dot com crash, and during the Global Financial Crisis).
“Yes, but Dave, interest rates have been zero for basically the last decade, so it has been easy to beat cash”.
Well, interest rates in the 80s were regularly above ten per cent, and it was only in 2010 that the moving average of the base rate (that we have used for the cash component for the above charts) dipped below the current base rate of 4.5%. For two thirds of the above data set, the cash “hurdle rate” used was above where interest rates sit today.
This is only half of the story too. When equities have outperformed cash, they have walloped it.
When stocks beat cash over rolling 15-year periods they have outperformed by 4.7% a year on average. In contrast, when cash has outperformed equities over the same fifteen year periods the average gap is a lot closer – 0.8% per annum.
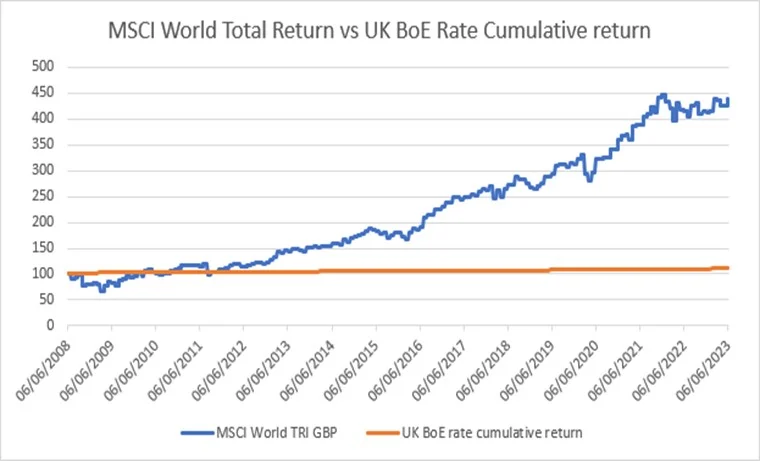
This is why long-term charts of equity returns versus cash tend to look like this…
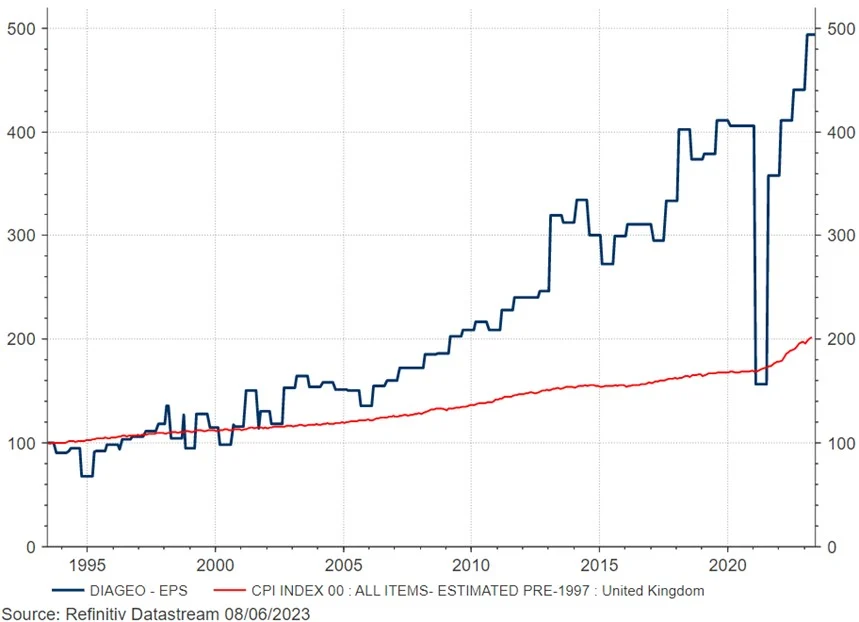
Of course, interest rates are only where they are because of inflation. Parking cash in the bank at 4.5% all of a sudden doesn’t feel too clever in a world where inflation is running at 8.7%. By keeping cash in the bank today you are accepting a historically high erosion of your purchasing power. “Risk-free return” is a myth.
Although stocks are often an imperfect inflation hedge in the short term (hello 2022), over the long term they are one of the best inflation-hedges we have. As the price of a pint of Guinness rises seemingly daily, I take comfort in the fact that as a shareholder in Diageo I am somewhat hedged against this rising cost.
And they say that great businesses don’t list in London.
If we want to protect the real (inflation adjusted) value of your capital over medium and long time periods, we have no option but to accept the short-term volatility of the stock market.
The good news is that we can all adopt behaviours to mitigate the worst of the pain along the way – diversify our portfolios into asset classes other than equities and cash, don’t look too frequently at our investments and finally be patient. Good things come to those who wait.
*We have used the MSCI World Index for the global stock market’s performance, and a moving average of the Bank of England Base Rate for the cash return. With thanks to Matthew and the folks at Refinitiv for the help with getting these charts together.
This is a marketing communication and is not independent investment research. Financial Instruments referred to are not subject to a prohibition on dealing ahead of the dissemination marketing communications. Any reference to any securities or instruments is not a personal recommendation and it should not be regarded as a solicitation or an offer to buy or sell any securities or instruments mentioned in it
—
The MSCI information may only be used for your internal use, may not be reproduced or redisseminated in any form and may not be used as a basis for or a component of any financial instruments or products or indices. None of the MSCI information is intended to constitute investment advice or a recommendation to make (or refrain from making) any kind of investment decision and may not be relied on as such. Historical data and analysis should not be taken as an indication or guarantee of any future performance analysis, forecast or prediction. The MSCI information is provided on an “as is” basis and the user of this information assumes the entire risk of any use made of this information. MSCI, each of its affiliates and each other person involved in or related to compiling, computing or creating any MSCI information (collectively, the “MSCI Parties”) expressly disclaims all warranties (including, without limitation, any warranties of originality, accuracy, completeness, timeliness, non-infringement, merchantability and fitness for a particular purpose) with respect to this information. Without limiting any of the foregoing, in no event shall any MSCI Party have any liability for any direct, indirect, special, incidental, punitive, consequential (including, without limitation, lost profits) or any other damages. (www.msci.com)


